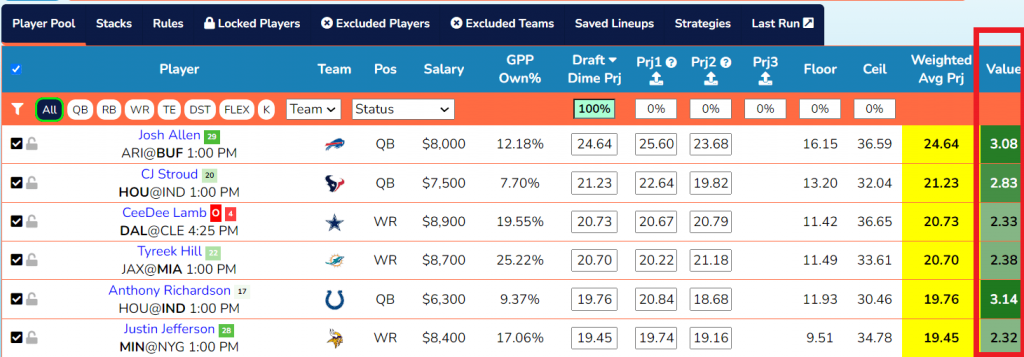
You might’ve noticed a bunch of numbers in the player pool, and it may seem like a lot. But don’t be overwhelmed–I’ll go through each column individually and explain exactly what it means.
DvP (Defense vs Position)
For the NFL and NBA, knowing how a team ranks against a specific player’s position is crucial. For instance, Week 1, Josh Allen is going up against the Cardinals Defense. The Cardinals rank 29th out of 32 teams against opposing QBs, as shown in the graphic below. This indicates a favorable matchup. On the other hand, CeeDee Lamb is going against the Cleveland Browns Defense, who rank 4th against opposing wide receivers, indicating an unfavorable matchup.
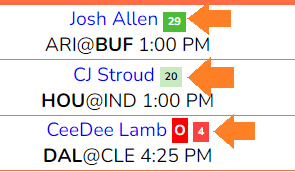
Please note that prior to the first 5 games of the season, we will use the previous year’s stats along with the current year stats. Once each team has accumulated at least 5 games, then we will use only the current year stats.
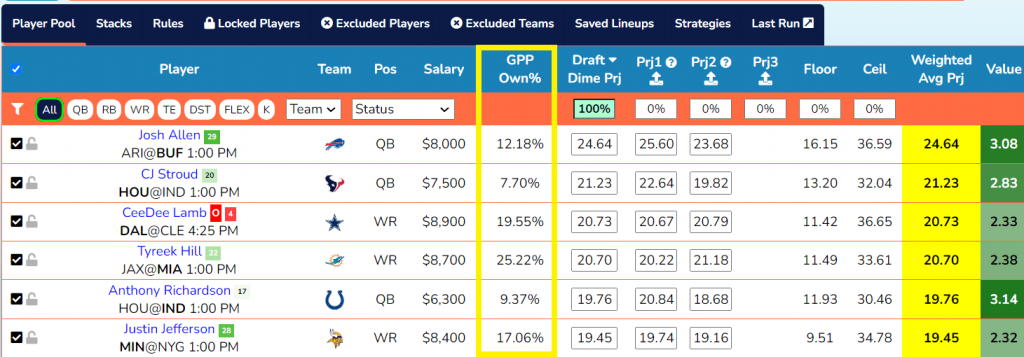
GPP OWN%
This field represents how much we expect a particular player to be owned in a big FanDuel or DraftKings tournament. It is important because it allows you to make important decisions about whether or not you want to fade a particular player, or whether or not you want to lock somebody in because you think they may be a sleeper pick.
DraftDime Prj
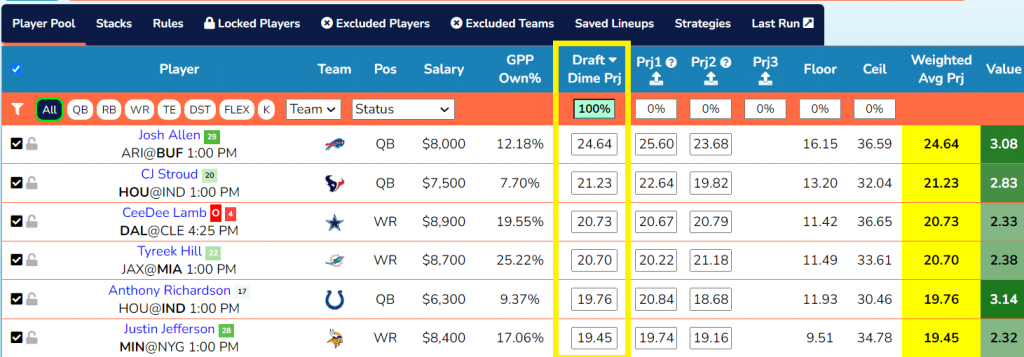
This field represents how many fantasy points we expect a particular player to score on a particular slate. This is by far the most important piece of data. We use an advanced model to create both our player projections and ownership projections. This model has evolved over the years and our projections have become increasingly more accurate every single season.
PRJ1 (Ownership-Adjusted Projections for GPP Lineups)
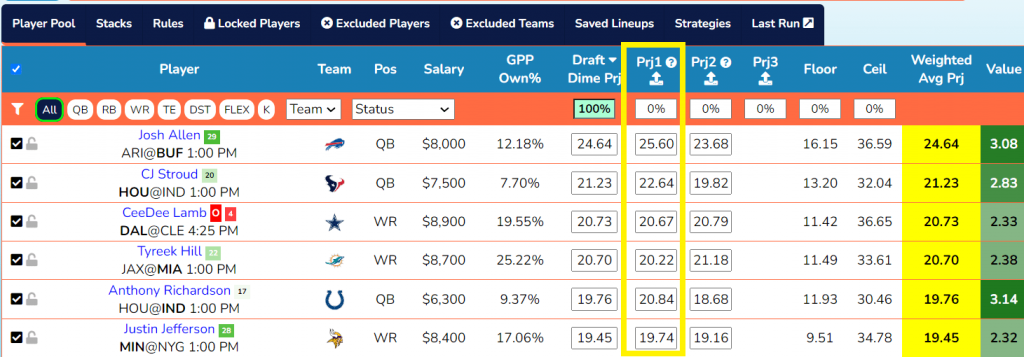
Our ownership-adjusted projections are a new feature. It is basically the same data as the DraftDime Prj, with one slight tweak. These projections are adjusted based on ownership. The higher the ownership projection for a particular player, the more we reduce his projection. The lower his ownership, the more we increase his projection. For instance, in the example below, Tyreek Hill is projected to be pretty highly owned at 25.22%. Therefore, we reduce his projection from 20.7 to 20.22. It’s nothing drastic, but it’s enough to make a difference in your lineup. It forces the optimizer to value lower-owned players, and penalizes higher-owned players, which is an important strategy for placing high in a large GPP tournament. It allows you to take a contrarian approach without having to do hours of research to identify potential sleeper picks.
PRJ2 (Ownership-Adjusted Projections for Cash Lineups)
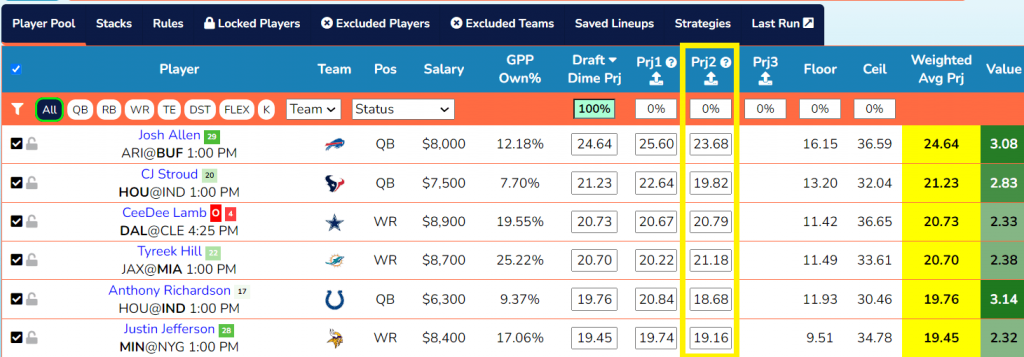
On the flip-side, our cash-adjusted projects operate in the opposite direction as our GPP-adjusted projections. In the case of Tyreek Hill, his cash-adjusted projection is increased from 20.22 to 21.18. Again, it’s nothing drastic, but it’s enough to make a difference in your lineup. It forces the optimizer to value higher-owned players, and penalizes lower-owned players. Unlike GPP, in cash lineups, you want to have higher-owned players, because you’re just trying to finish in the top 50% of lineups. You don’t need to take a contrarian approach.
PRJ3
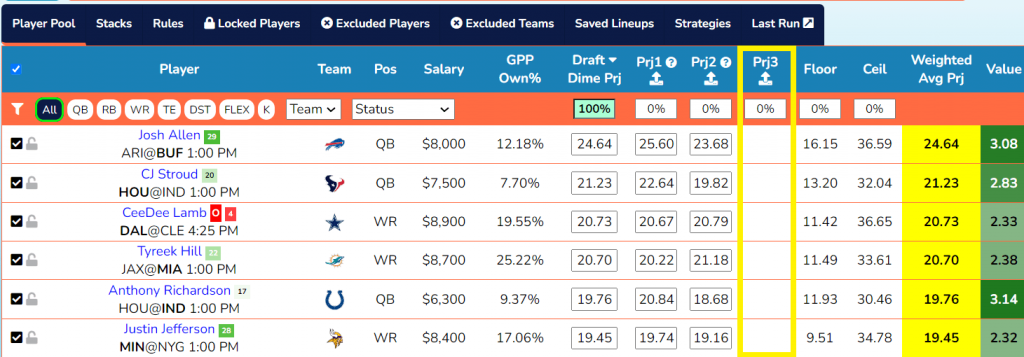
This field is empty because it allows you to import your own projections. You can also overwrite the projections in the PRJ1 and PRJ2 columns with your own custom projections. (See importing projections tutorial)
Floor and Ceiling
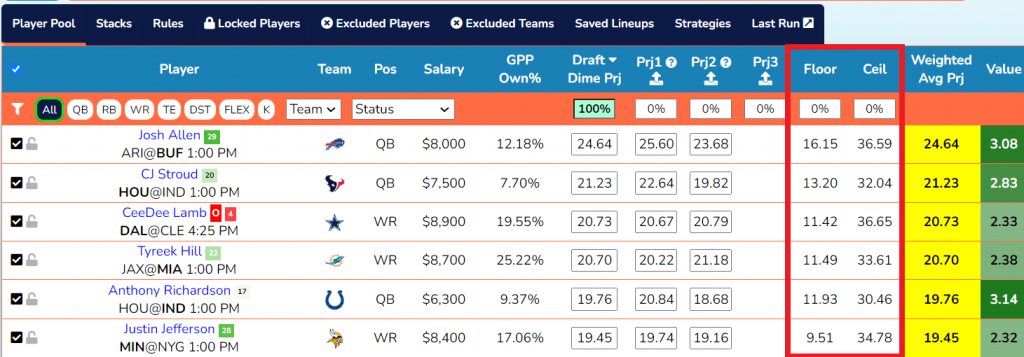
The floor field represents how many fantasy points we expect a particular player to have if that player has a bad game. On the flipside, the ceiling field represents how many fantasy points we expect that player to have if he has a good game.
Weighted Avg Prj
This field takes all of the above data and aggregates it based on the weight that you provide. The default setting is for there to be 100% weight on our DraftDime projections. However, you can change this. For instance, if you were to place 50% weight on PRJ1, and 50% weight on the DraftDime projections, the Weighted Avg Prj column would change to reflect that. So in the case of Justin Jefferson, the weighted avg prj would be (50% * 17.23) + (50% * 16.54), or 16.89. This is ultimately the number that is used by our model to provide you with the optimal lineup.

Value
The value is calculated as follows: Weighted Avg Prj / (Salary / 1000). Another way of looking at it is as Projected Fantasy Points Per Thousand Dollars. It’s a quick way of determining how valuable a particular player is based on how much he costs. You also might notice that each player’s value is a shade of green or red. The greener the background, the more valuable that player is. The redder the background, the less valuable that player is.
